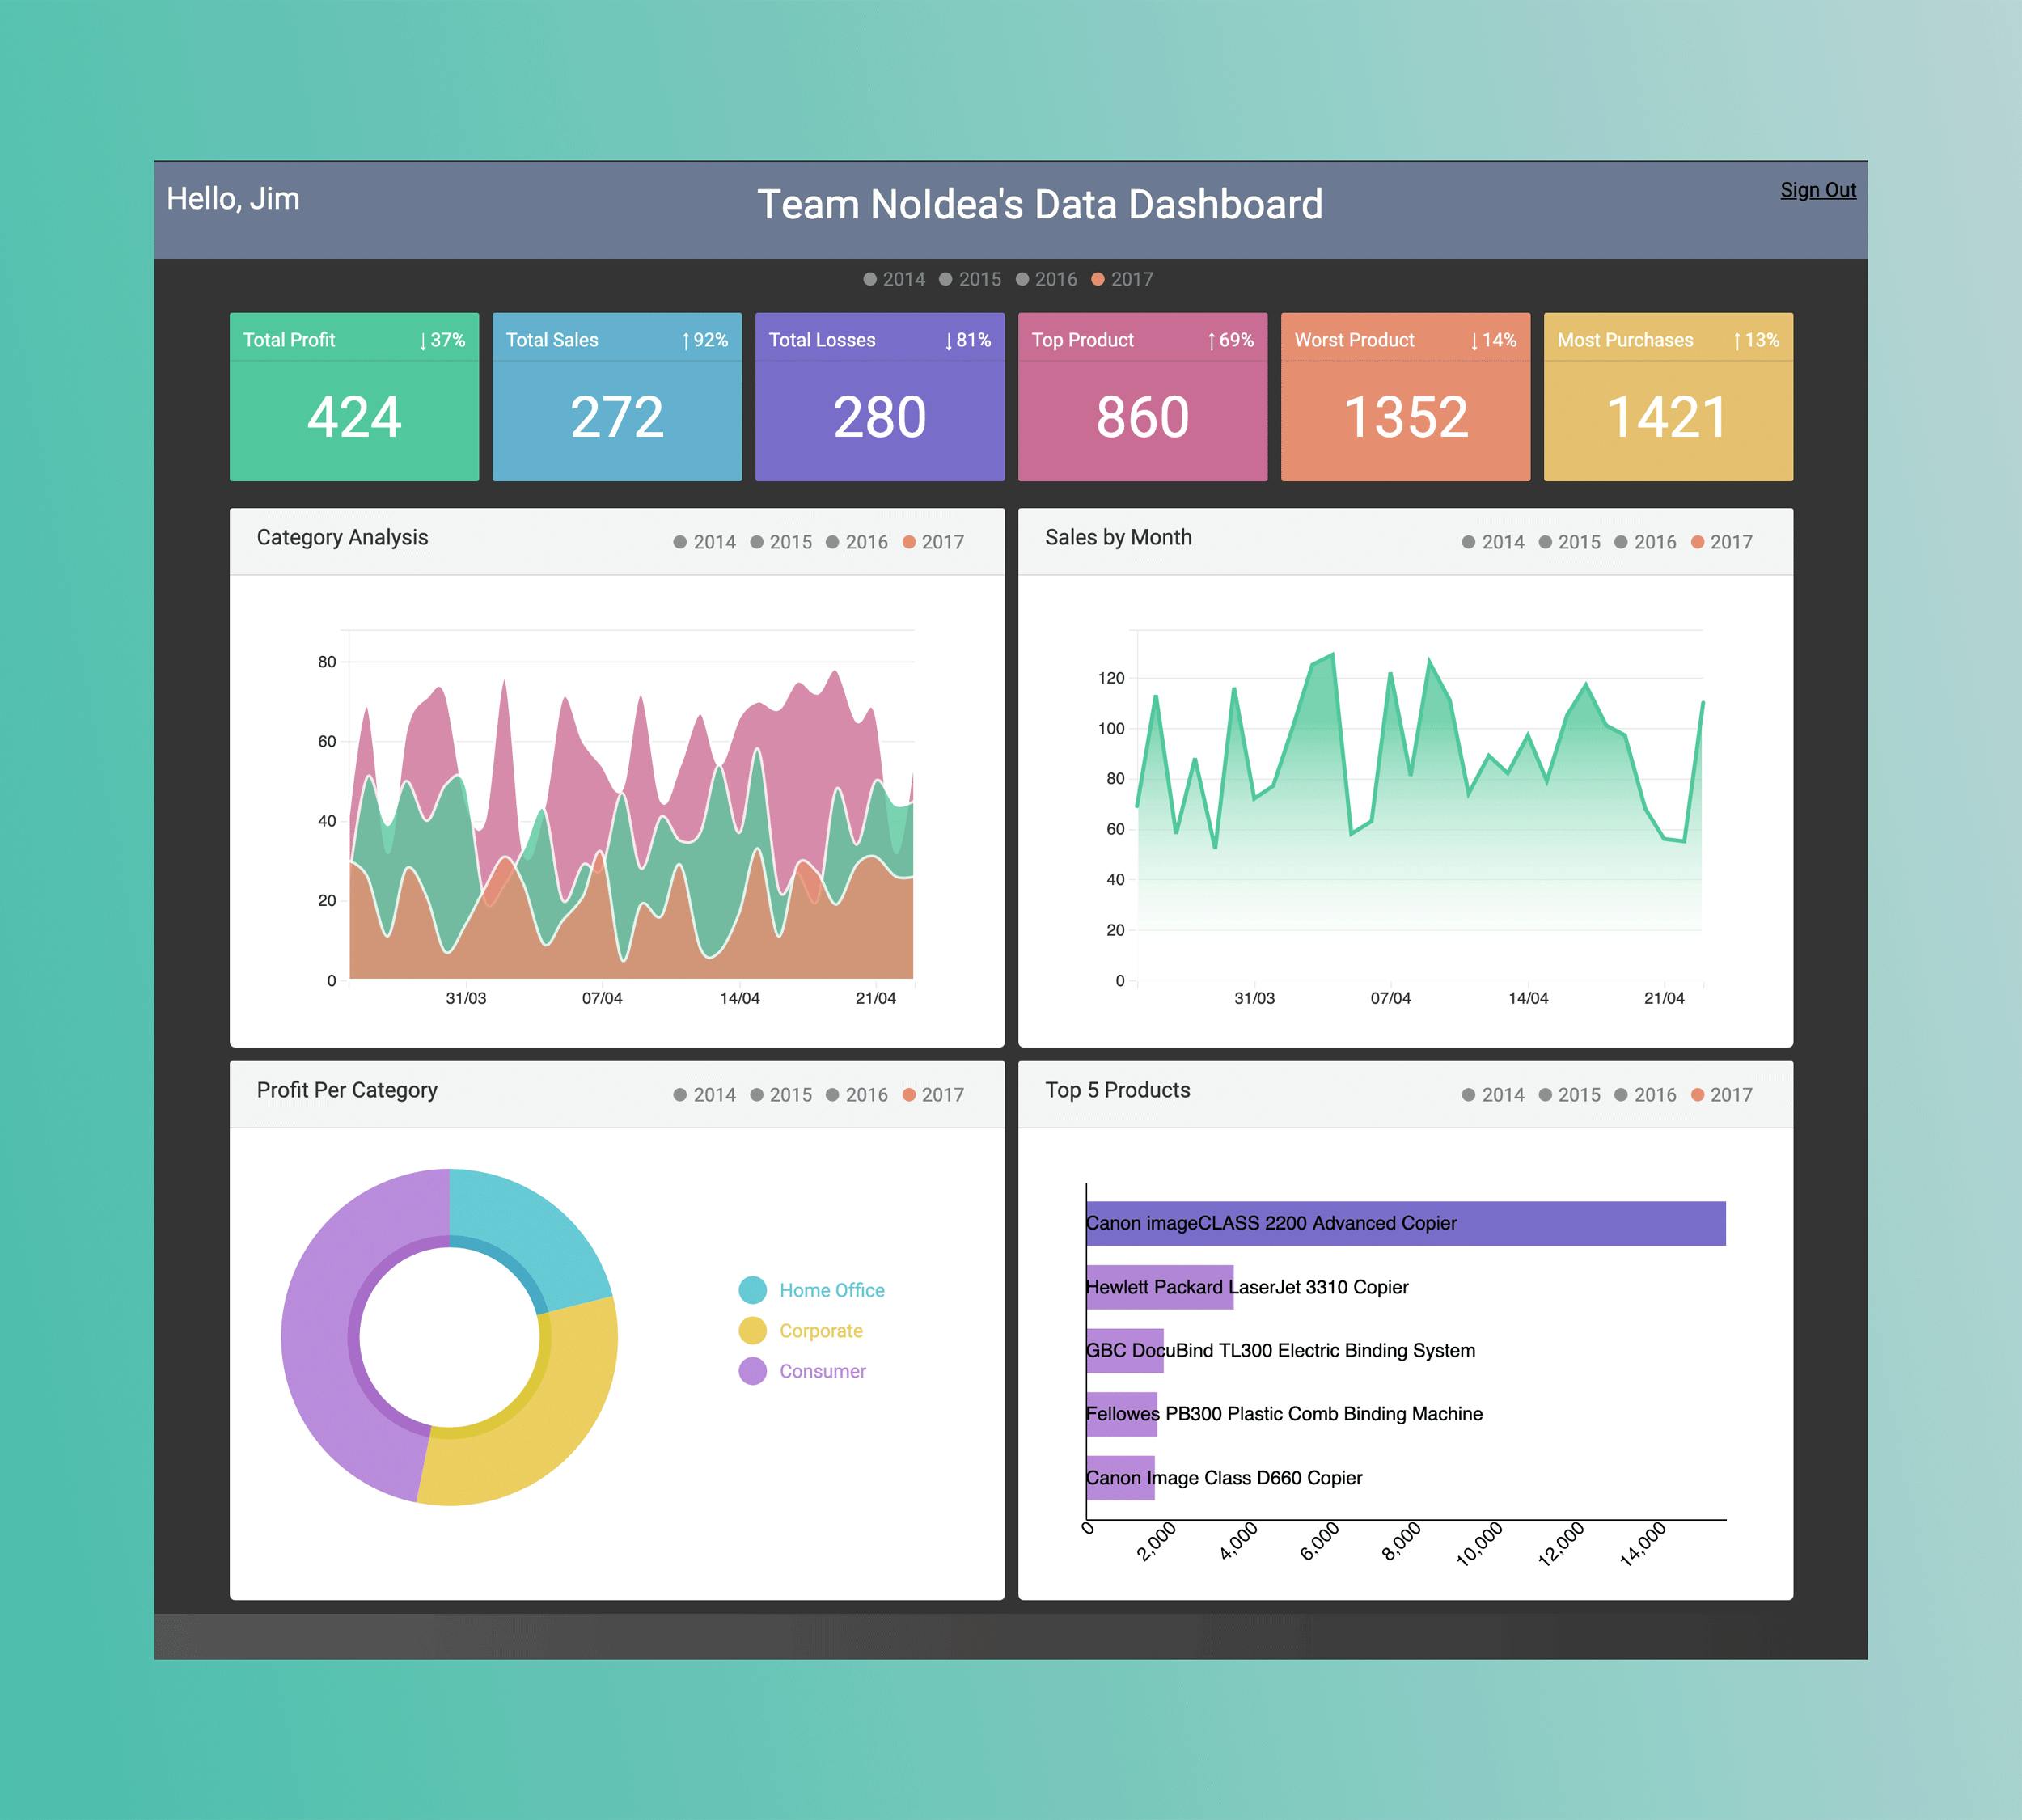

React & D3 Data Visualizations
Data visualizations that analyze a company's sales data. Built using Python and Flask on the backend and React.js, D3, and CSS on the frontend.
- https://github.com/colinnguyen95/React-D3-Data-Visualizations-Frontend
- https://github.com/colinnguyen95/React-D3-Data-Visualizations-API
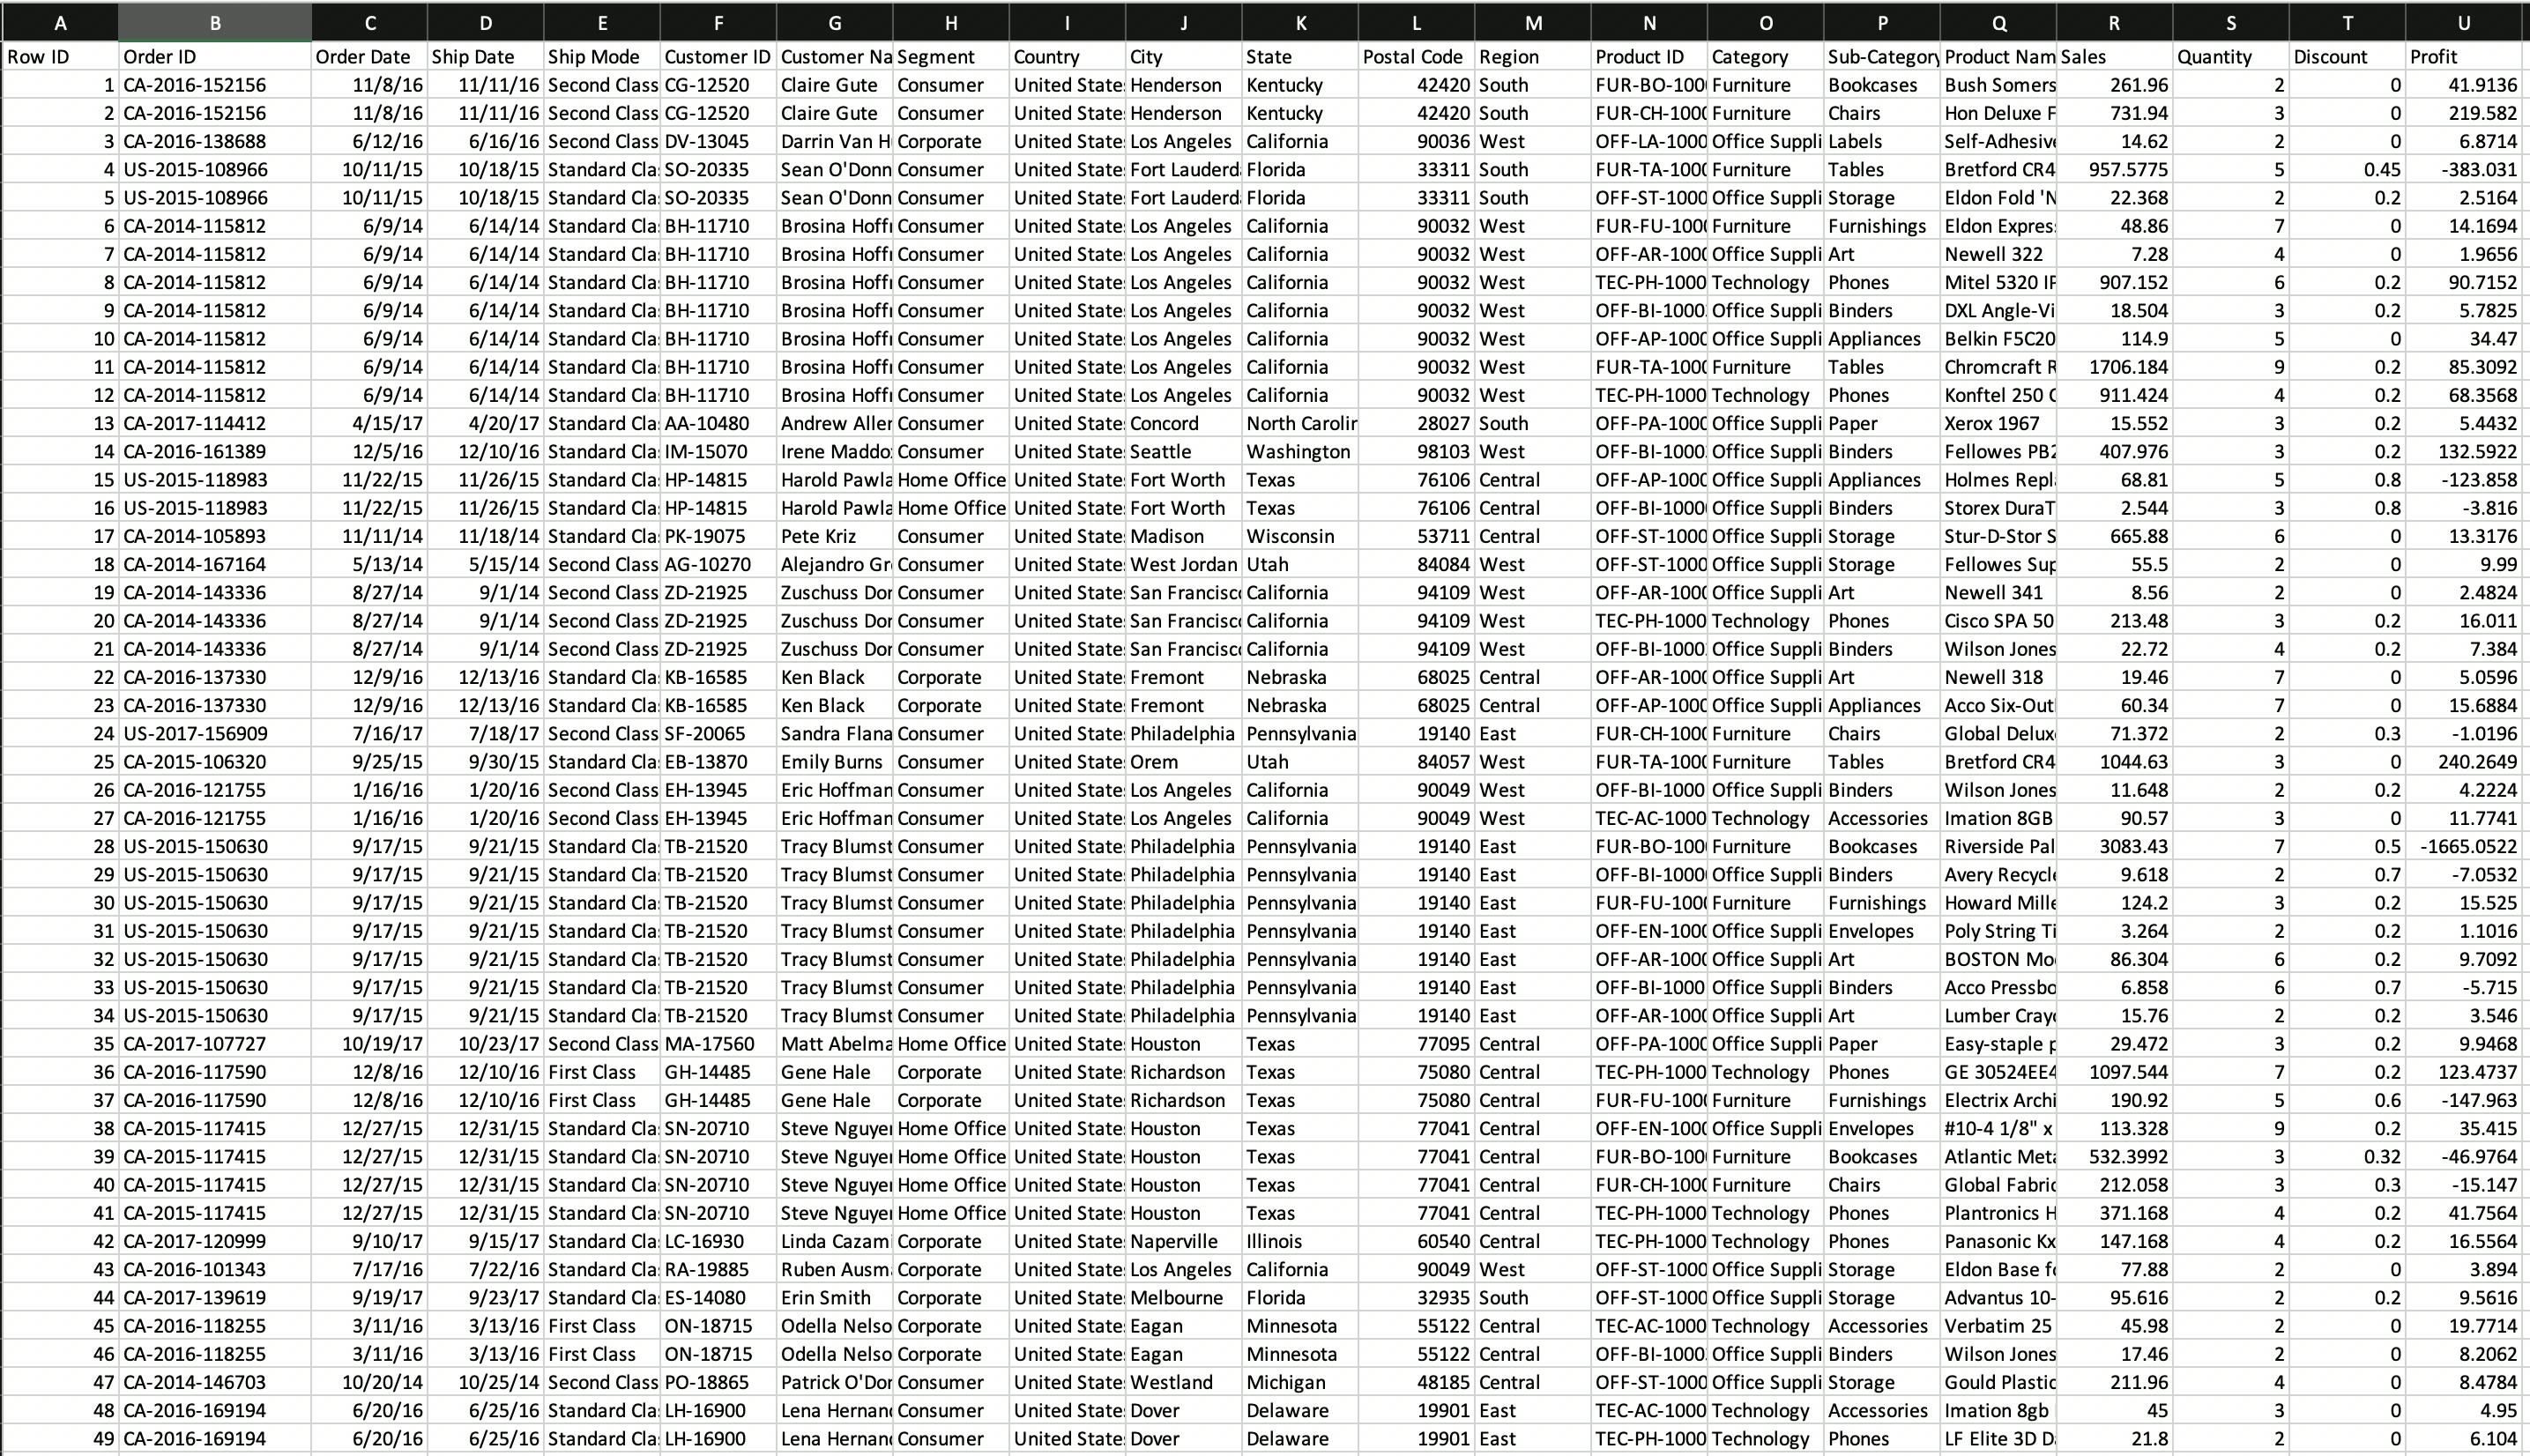
This was a semester-long school assignment turned into a personal project. The scope of the project only required Python, Pandas, and SQLite to create meaningful results from a mock company's sales data stored in excel. However, I felt that visualizations would be a better fit for data analysis and decisions in business. At the time I was already self-learning frontend technologies and wanted to challange myself by applying what I learned. I used React and D3 to create the User Interface of the application. The backend was built using Python, Flask, and Pandas, and SQLite.
The class was setup as agile teams using Scrum methodologies. We were purposefully not taught what to do, and it was up to the teams to research and learn the neccessary tools needed.
This project consists of:
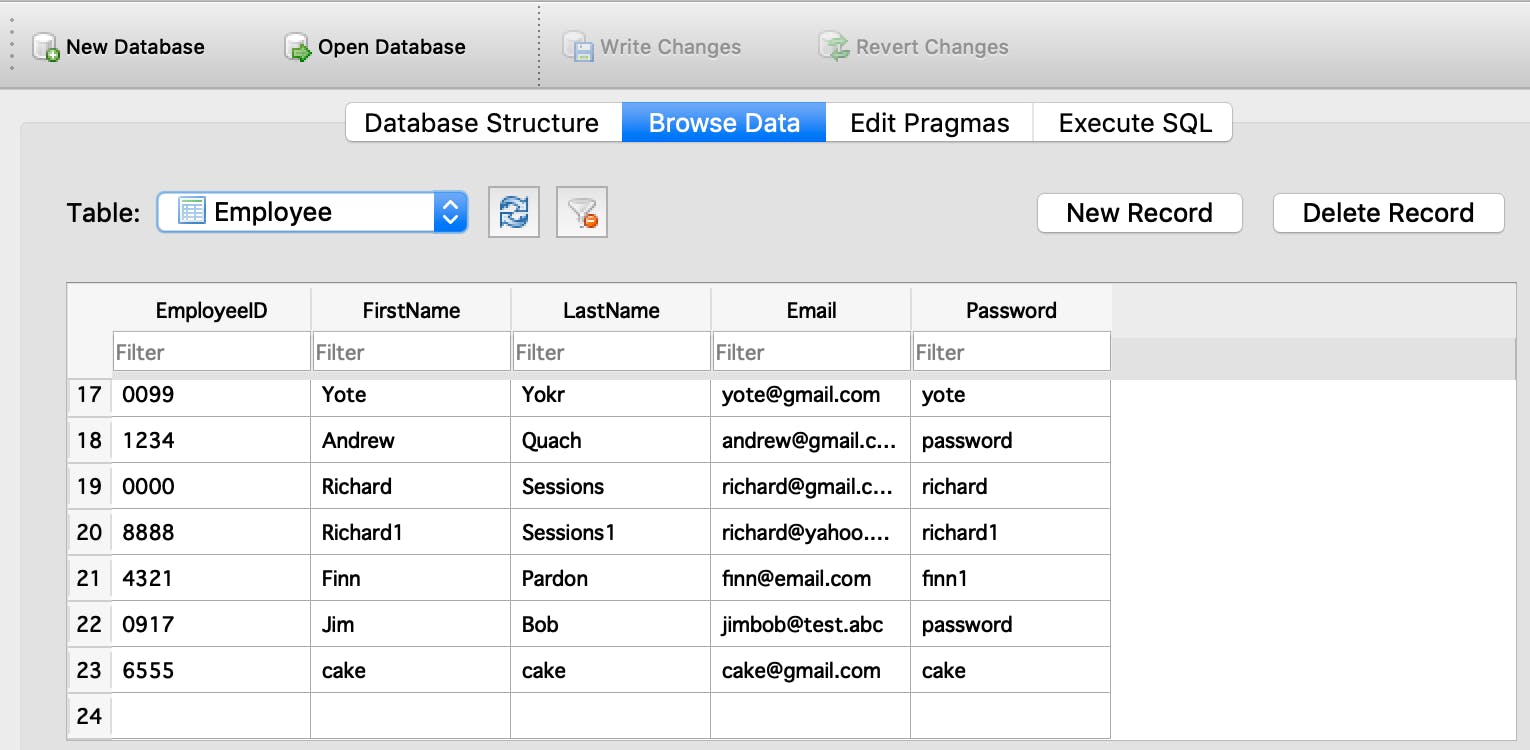
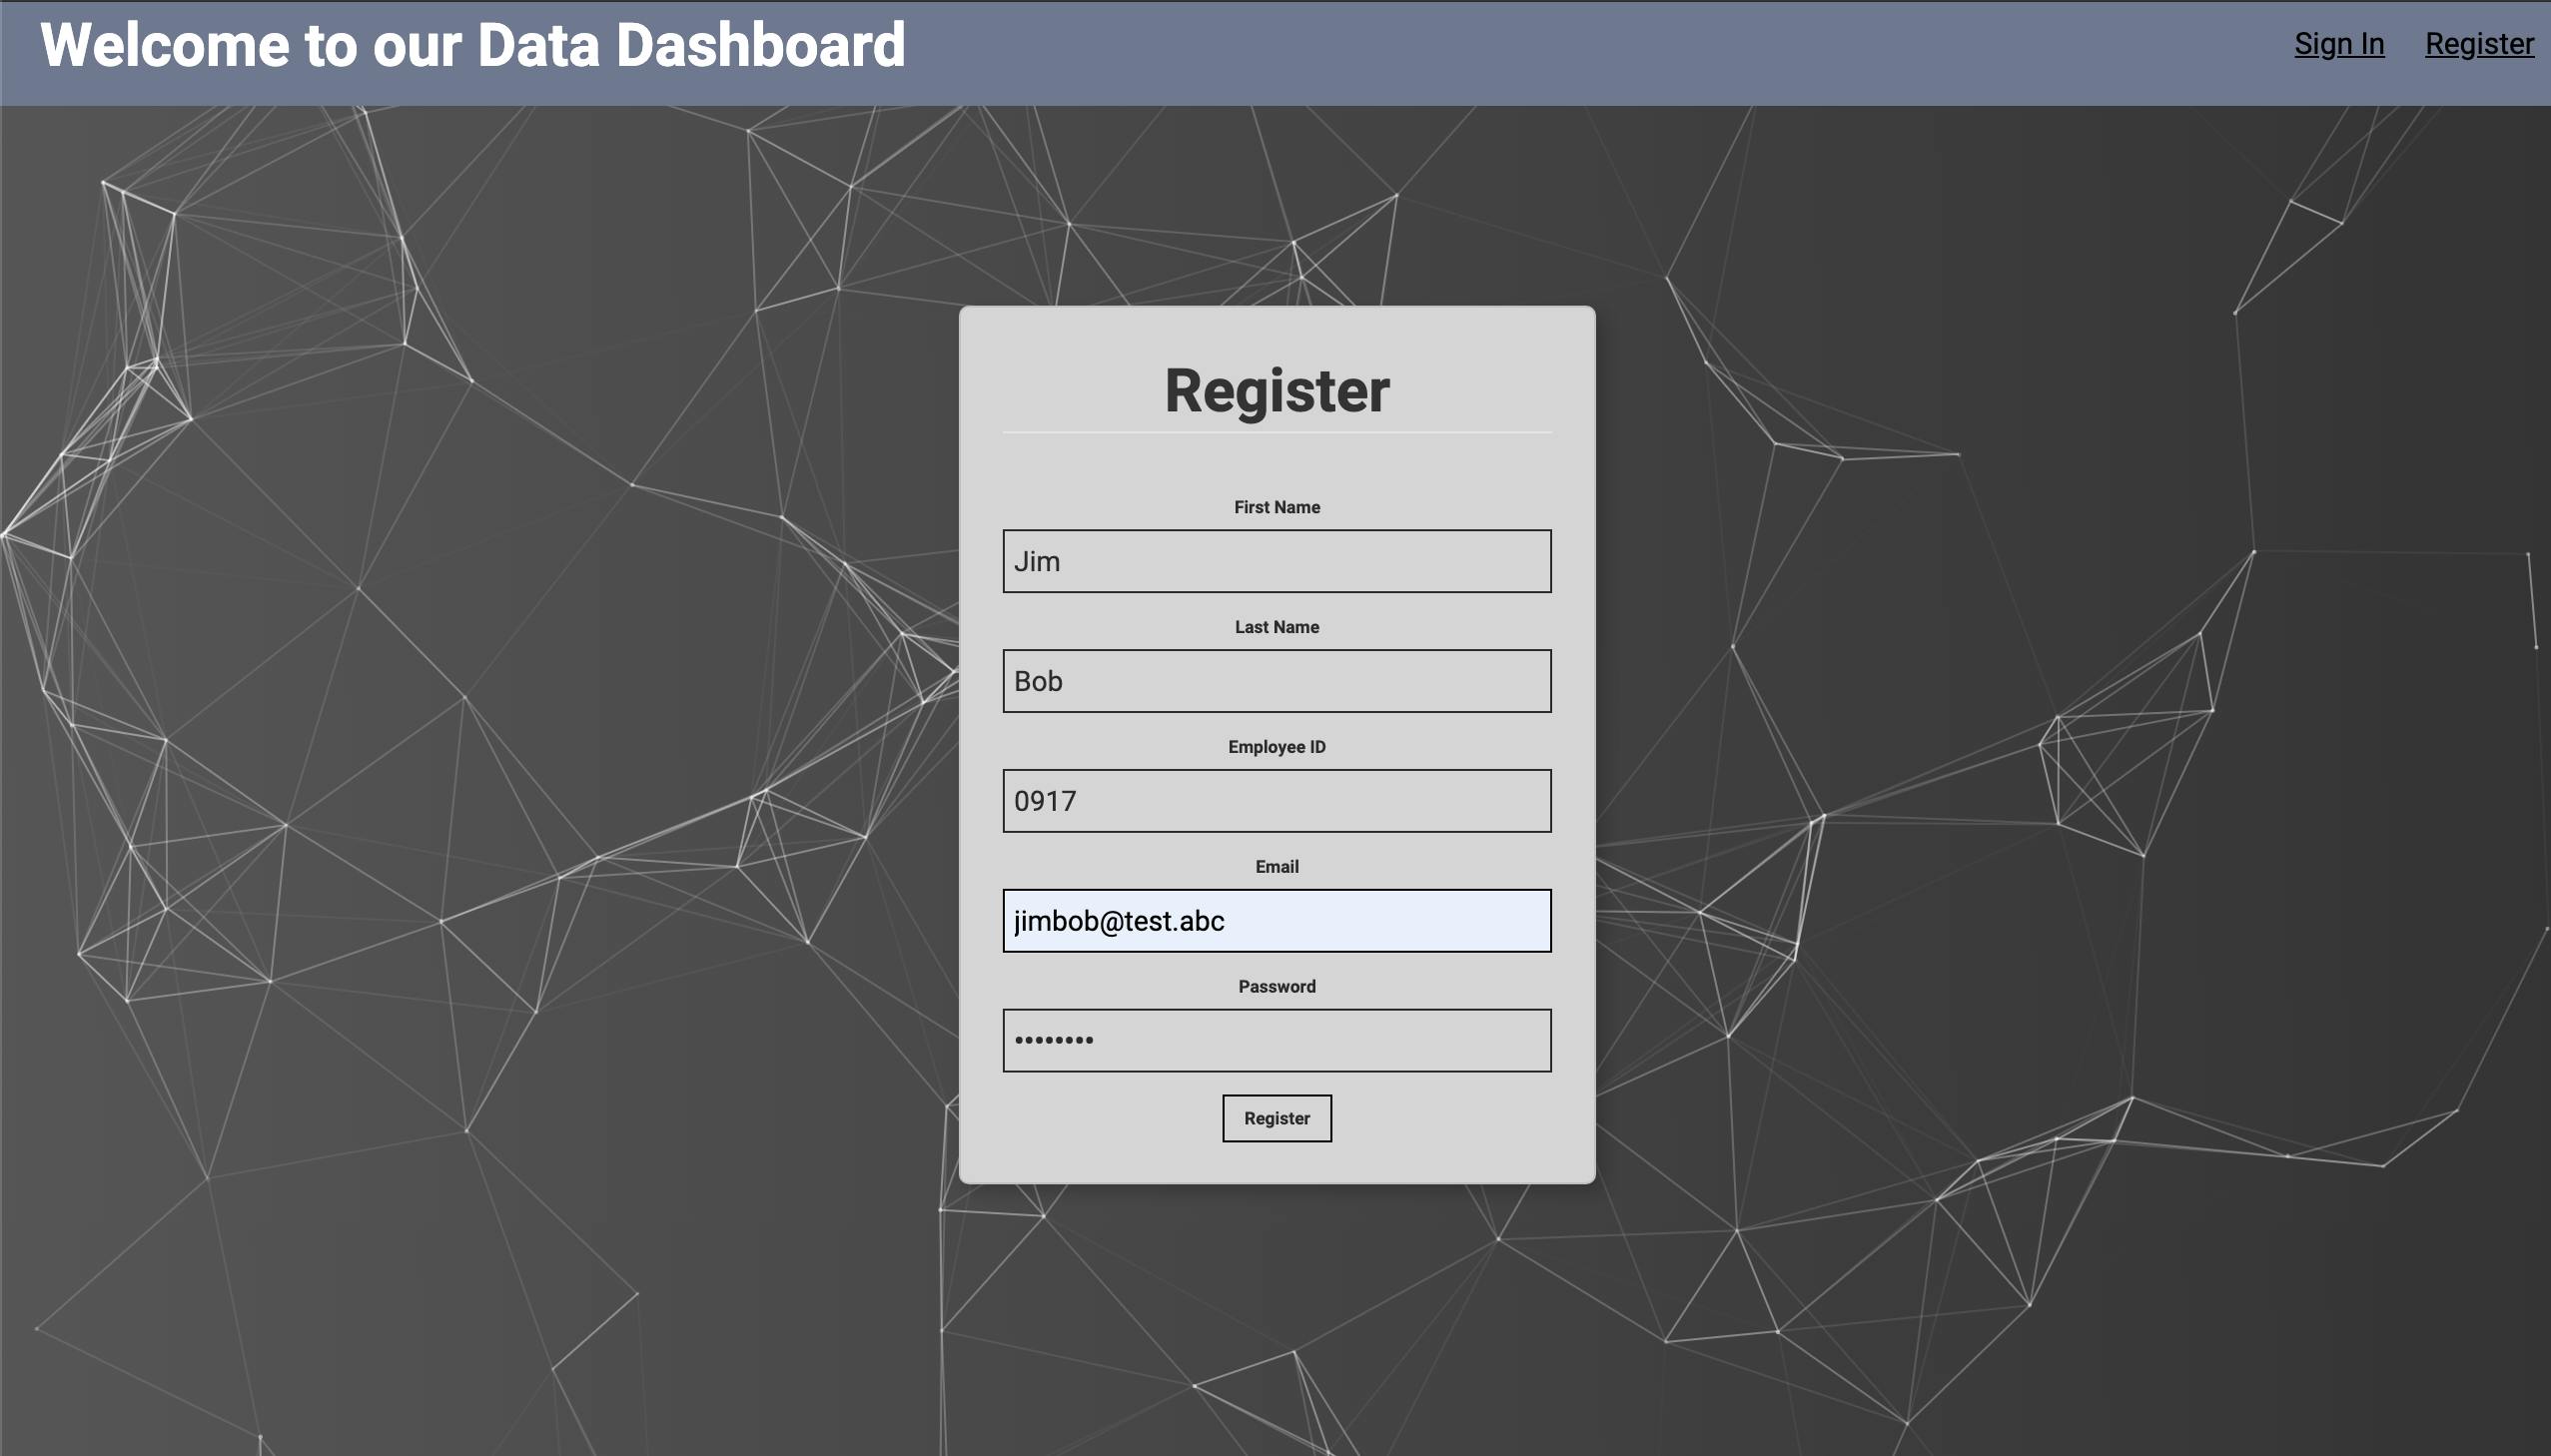
- Sign In,Sign Out, and Registration functions - SQL
- Data Manipulation - Python and Pandas
- Data Visualization - JavaScript and D3
- UI Elements - React, HTML, CSS, Bootstrap
Challenges
The biggest challenge was starting because I had no clue how to piece together everything and have a full functiong application. It took the team weeks of stressful researching, but I finally managed to understand how the frontend can talk to the backend, thanks to JSON and API calls.
At the time I was most comfortable creating backends using Node.js and Express, but the class required Python since we had to utilize Pandas, the Python library, for data manipulation. To get around this, I learned and used a microframework for Python called Flask to create endpoints for my frontend to reach.